Chapter 2 Music Creator’s Earnings
The global music industry has two well-known global reports: The Global Music Report of IFPI, which covers total revenues in almost all territories for producers and partly performers; and the CISAC Global Collections Report that contains total revenues from collectively managed author’s revenues. Both organizations collect (rather different) international data which is only available to their members. There are also national music industry reports available with variable depth of content and analysis, like the UK Music in Numbers series. The more fragmented live music industry does not have any comprehensive global or European report. We also do not have a truly comprehensive report on global publisher revenues that are not collectively managed.
These reports, because they were designed to set business targets for larger organizations, and not to analyze the economics of music or to provide guidance to smaller entities and individual rightsholders, are not suitable for the analysis of music creator’s earnings. They are also not suitable to govern business decisions of independent labels and artists, or to provide evidence for the claims when they do not receive a fair or equitable remuneration. Indicators for the average or typical rightsholder, work, or recordings cannot be inferred from these reports.
The Digital Music Observatory—following the blueprints of the planned European Music Observatory—was set up with many years of work to overcome these shortcomings. Originally called the CEEMID initiative (Artisjus et al. 2014), it started data collection and data harmonization among relatively data poor Central European countries, but as experience showed, Western, more advanced, and future markets like Armenia share vey similar problems.
This was the reason why Consolidated Independent (from the state51 music group) teamed up with CEEMID to make a showcase for a permanent, harmonized, international data collection program. Our Central European Music Industry Report was prepared with the help of 60 music organizations in 12 countries, including the United Kingdom, and analysed rightsholders earnings in various distribution channels, including, but not limited to streaming, in 20 markets.
The idea of this observatory was brought to the UK policy debate on music streaming by the observatory’s only (former) British users, via the Written evidence submitted by The state51 Music Group to the Economics of music streaming review of the DCMS Committee (state51 Music Group 2020; Antal 2020a).
“There are instructive initiatives in other industries in which there is perhaps a clearer and longer standing recognition of the role of economic analysis. This sometimes results in initiatives such as ‘Observatories’ like the European Market Observatory for Fisheries an Aquatorial Products or the European construction sector observatory […] These tend to be collaborative endeavours, with a varying mix of government, industry, economists and in some cases funding bodies. […] To date there have been few if any entities or initiatives for music similar to the above-mentioned observatories. We suggest this is something that policy makers can support and encourage, but which ultimately needs to be driven by the industry itself. […] This is one reason we have worked with the economist Daniel Antal and his team, in particular on the Central European Music Industry Report 2020. Economists such as Daniel Antal produce data about the music industry that is consistent with international statistical standards and adhere to rigorous data ethics principles, seeking external validation through data and code repositories for underlying data and methodologies.”
The data observatory concept is derived from Earth and natural sciences, where often many research stakeholders build large observation stations, such as the Hubble telescope in space, or CERN. Data observatories are managed by a triangular stakeholder base of business, scientific, and policy stakeholders. The music industry requires a permanent market monitoring facility to win fights in competition tribunals, because it is increasingly disputing revenues with the world’s biggest data owners.
This was precisely the role of the former CEEMID program, that was initiated by a few collective management societies after a dropped GESAC project. Starting out from three relatively data-poor countries, where data pooling allowed rightsholders to increase revenues, the CEEMID data collection program was extended by 2019 to 12 countries. It was eventually transformed into the Demo Music Observatory in 2020 (Antal 2021), which is now open for any national rightsholder, stakeholder organization or music research institute.
The average and median (typical) earnings cannot be calculated arithmetically—the average does not exist if we do not know the number of works, and the median cannot be observerd if we do not know how many works, recordings, or rightholders to rank. The mean values are also rather useless because of the large concentration of revenues in a greatest hits segment.
This problem is not specific for the music industry. Copyrights and neighbouring rights are claims for future cash flows, just like stocks and bonds. Many of the aspects mentioned above are present in the empirical analysis of stock and bond securities markets, where the global universe of investible securities is vast and changing daily, particularly in the bond market. Bonds often have only 30- or 90-days lifespan, they “expire” and new bonds are re-issued. Most copyrights and neighbouring rights only earn revenues in the first 1-2 years of their lifespan but remain in the copyright-protected universe potentially for 100-200 years.
The fact that copyrights and neighboring rights are fixed in term (even though often they are fixed relative to an unknown event, the death of the composer), they are similar to fixed income (bond markets). Eventually all rights will enter the public domain and stop paying royalties.
The fact that each music work and recording has a variable number of streams at a monthly varying price in varying territories makes streaming similar to dividend-paying stocks. Streaming payouts, like stock dividends or prices, are autocorrelated (March offers an insight into April earnings) but unpredictable in the long-run. Many songs enter a similar phase where they stop earning any royalties—much like the stocks of companies that cease to exist.
The reports of IPFI and CISAC, in a financial market analogy, are describing the annual growth of market capitalization, but not the individual or even typical performance of assets. Market capitalization can grow as the number of investible stocks, bonds, or streamable songs grows, even if representative sales volumes and prices fall. These are not useful for the characterization of the economic situation of investors or rightsholders. Instead, we pioneered the creation of indexes that represent the market view of a particular rightsholder.
The CEEMID-CI indexes slightly resemble the approach of the Standard&Poor, Dow Jones, or iBoxx indexes. Indexing is complicated—the formula and know-how to create these well-known indexes is protected intellectual property, and we only used some of their methods to create our proprietary streaming indexes. Our indexes were not created for the MCE report, and we would have used a different indexing for this purpose, but we believe that our “typical” indexes are very useful for the aims of the MCE project.
Our indexes paint a more rosy picture than that view from a ‘typical’ rightsholder. Our index shows what happens with the typical song of the month. Every month, we selected those songs that were performing better than half of the songs in a particular country, and worse than the other half in the CI portfolio. This is the median value of the songs that were listened to by anybody in a particular country, and not a measure of all possible songs. The median (typical) value for all songs is zero, because there are so many more copyright and neighbouring right protected works and recordings available every given month than the amount which are played at least once.
In the period of 2015-2019, the typically exploited song in a large, independent portfolio exhibited the following characteristics:
- The audience expressed in the volume (quantity) of the the monthly streams was generally increasing.
- The monthly revenues were flat.
- The prices of a single stream were declining.
- The variability (risk) of the earnings from month to month was greater in emerging markets.
- The greater risk in emerging markets was compensated with higher volume growth, and higher revenue growth, just like in financial markets.
- The revenues of poor markets were high relative to the household cultural spending differences. Often we felt that the streaming providers made pricing mistakes, or inconsistent pricing in national markets. The likely cause is that neither the streaming providers nor the rightsholders made adequate market research into sales and price planning in the smaller markets, and naturally this increased the riskiness of international revenues.
2.1 CEEMID-CI Streaming Value Index
The revenues for the typical used song were roughly flat in almost all markets. This means a decline in streaming value in the case of flat volumes. Our finding is not contradicting the IFPI reports of rising total value. Streaming services are lincensed to more and more markets, and more and more recordings (from the newer territories, from the back catalogue, and new releases) are becoming available to a growing global audience. Because of the internationally competitive British repertoire, this means growth for the UK industry, at least in the domestic perspective, though in the national perspective the growing international competition may lead to loss of market share for invidiual rightsholders who are UK nationals.
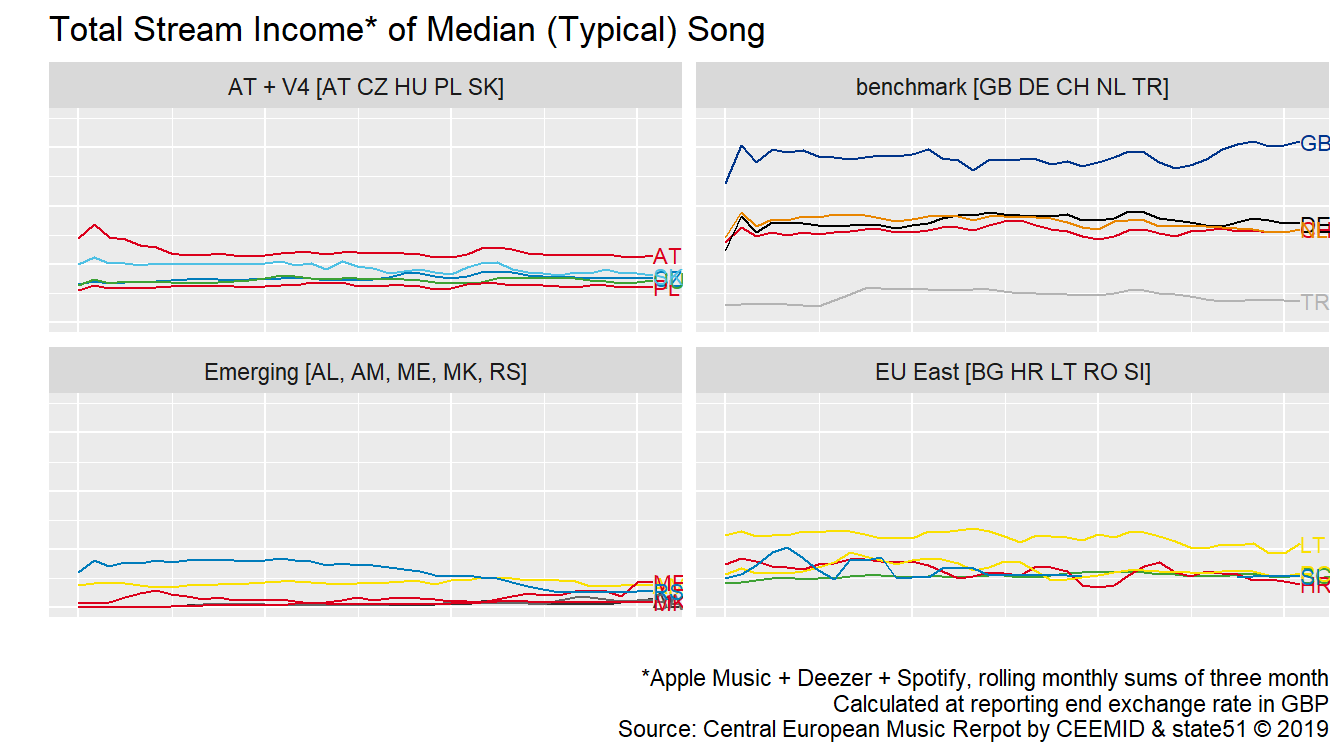
Figure 2.1: Total Monthly Streams of a Typical Song in the United Kingdom and 19 European Markets
2.2 CEEMID-CI Streaming Volume Index
The streaming volumes in the earlier saturating, advanced markets of the United Kingdom and Germany showed slightly increasing or flat volumes for the typical used song. This is likely to mean a decline for the typical song, but the typical (median) song is not played in any given period, i.e. month. Emerging markets, where the service is later introduced, show initial growth.
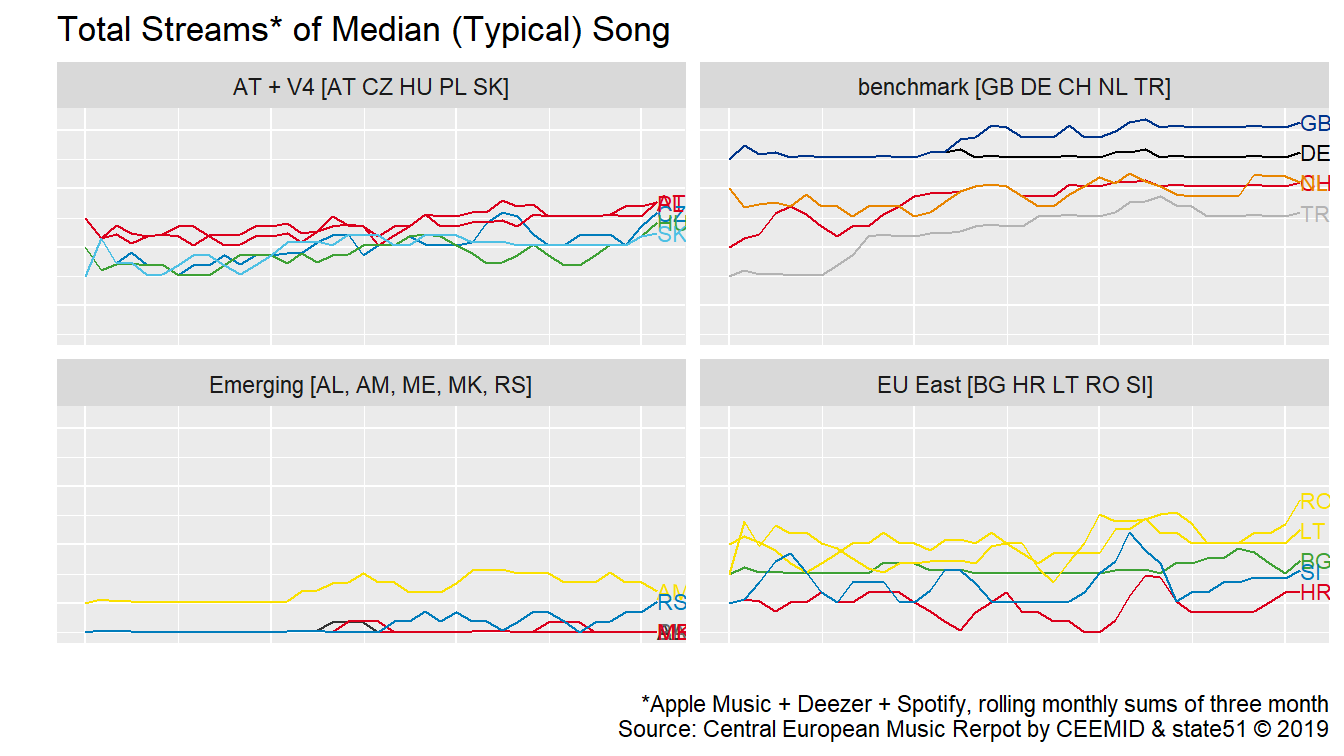
Figure 2.2: Total Monthly Streams of a Typical Song in the United Kingdom and 19 European Markets
2.3 CEEMID-CI Streaming Price Index
When volumes are rising and revenues are flat then prices must be falling. We have seen lowering prices per stream in almost all territories, expressed in GBP terms. Germany’s flat price in GBP is the result of a falling euro price offset by the devaluation of the British pound against the euro.
Streaming services logically target first the upper middle class users, and then offer cheaper subscriptions for families or students. The falling unit price follows the profit optimisation of streaming providers.
At first sight we may be surprised by relative high earning potential of poor markets like Albania. We attributed the relatively high remuneration in these countries to a low level of competition (few subscribers, fewer exploited songs) and the effect of various minimum licensing fees.
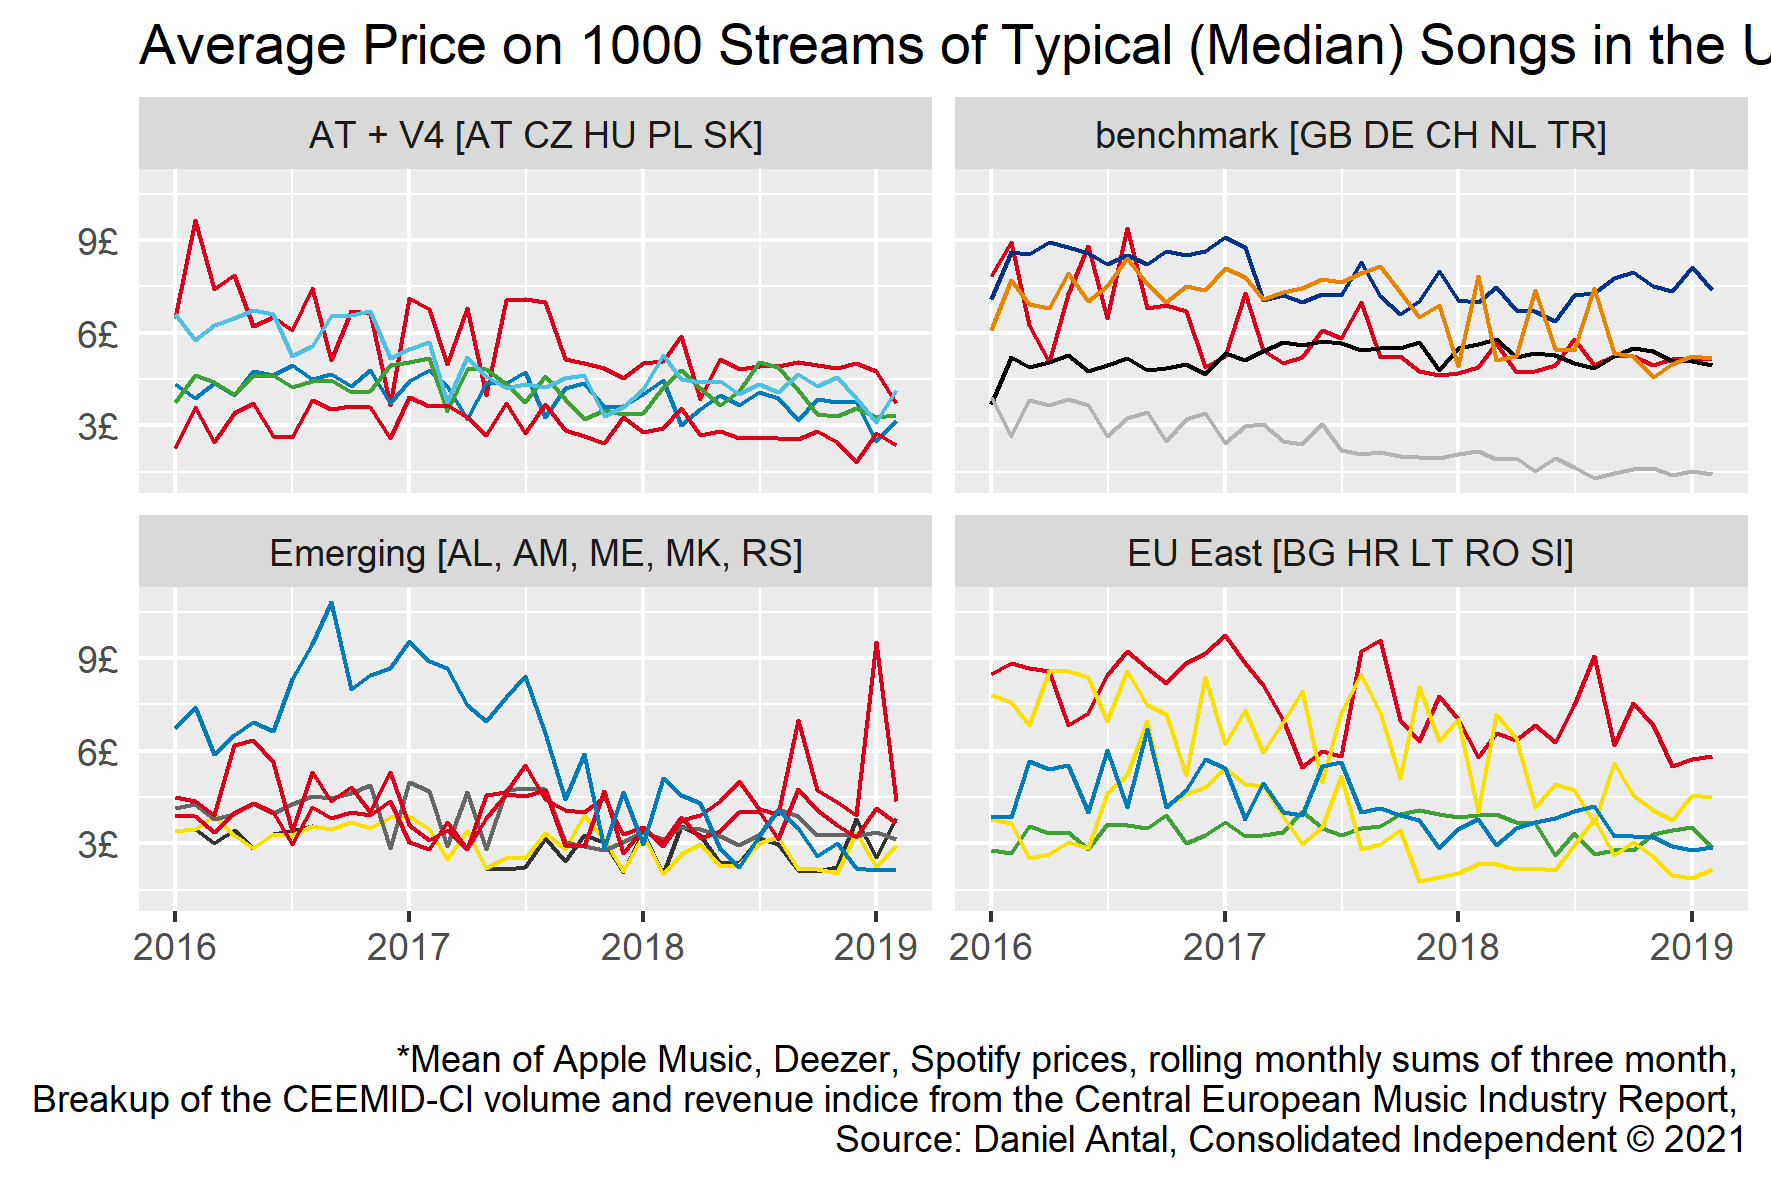
Figure 2.3: Total Monthly Streams of a Typical Song in the United Kingdom and 19 European Markets
In fact, we can see the very same effect within the United Kingdom, where the relatively new Apple Music behaves like an “emerging market” provider. In our report we hypothesized two explanations.
- Rightsholders set a minimum licensing fee at the beginning of a new license. In the first months, when there are only a small number of subscribers who stream a small number of songs, the average revenue on each song is relatively high.
- There is a price discrimination present. Each service provider sells for the most interested consumer groups first, then offers various sales, and then rolls out family packages, where the subscription fee per household member is very low.
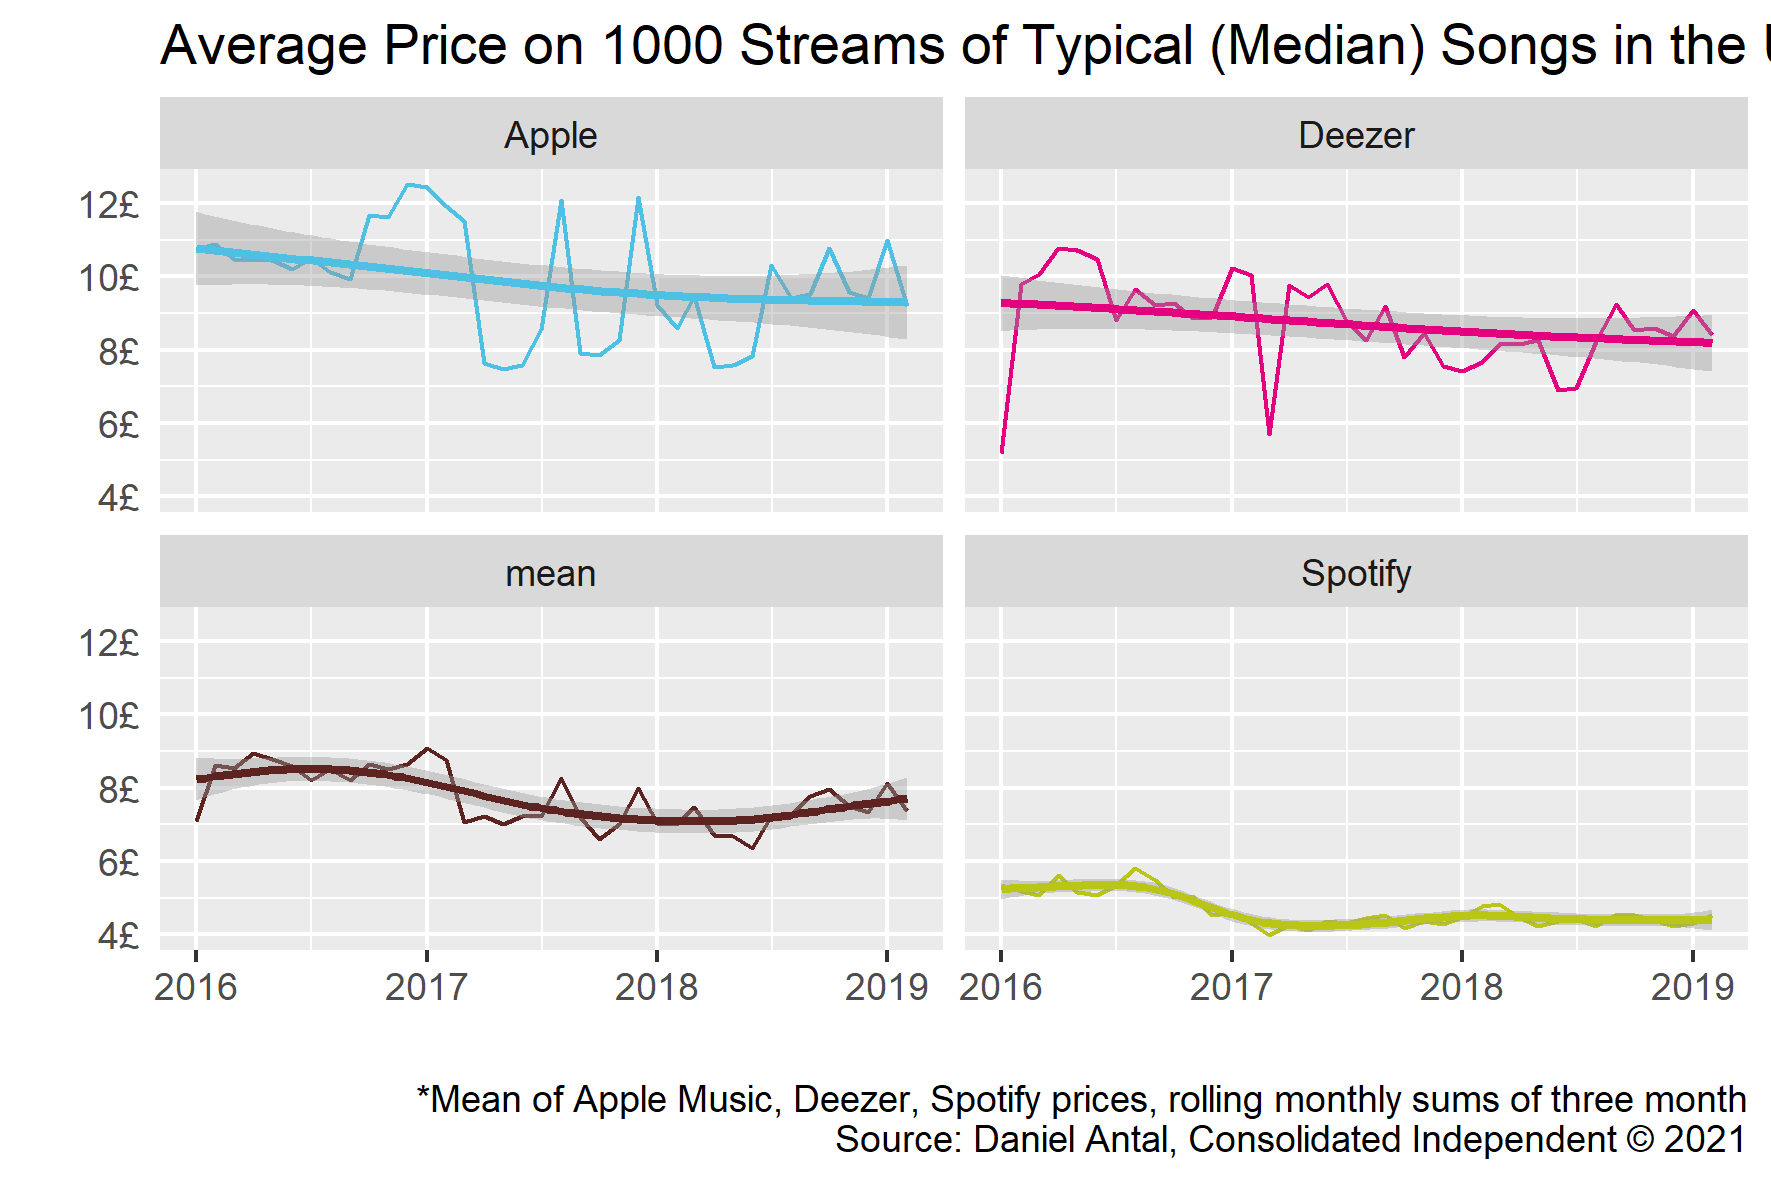
Figure 2.4: Quarterly Moving Average Price of a Typical Song in the United Kingdom
While it is tempting to single out Spotify as a lowest value provider, Spotify usually generates the highest volumes. The streaming service providers are rolling out subscriptions to different parts of society, and at different costs. For Spotify, the largest marketing cost is access to Apple’s in-app purchase system. Spotify has challenged Apple on similar related cases in the UK, in the Netherlands and in EU jurisdictions (Chee 2021).
In this period, we did not see a very strong logic in how the subscription fees were set by the various streaming providers, though generally speaking, they set higher subscription fees in richer markets. Richer markets had higher subscriber bases, higher subscription fees, but also a higher level of repertoire competition—as larger parts of society could afford to buy electronic appliances and pay for subscription fees, they were interested in a broader repertoire of music. In small markets, where usually upper-middle class subscribers were present, the repertoire used was more homogeneous. In the 19 markets, we saw very different levels of interest for domestic and foreign music.
The index values for the United Kingdom can be used as a benchmark for domestic revenues for the UK Music Industry, particulary for smaller rightsholders who are British nationals or British taxpayers. But because of the international competitiveness of the UK repertoire, even these artists are earning foreign revenues. For benchmarking the domestic (as opposed to national) revenues, an internationally diversified portfolio is a better point of reference. The UK music industry often represents foreign artists, too, who may have their main audience outside the UK.
One measure of competitiveness for a recording is its ability to draw revenues for many jurisdictions. Music is a predominantly local business: most musicians have a smaller fan base than a country. Some bands may have followers only in Cardiff, or in Wales; some Welsh bands may be well-known in the entire United Kingdom but not abroad. And some of them are streamed globally. Any artists who can draw revenues from more lucrative markets than the United Kingdom may be better remunerated than the ‘typical’ British artist. And an artist who has many followers in relatively less lucrative markets, for example, in Eastern Europe, may receive less remuneration on the same number of streams.
2.3.1 Publishing side
We do not have direct information about the publishing side, and we believe that this is more difficult to observe. Some rightsholders, particularly large publishers, are licensing their songs directly to YouTube, Apple Music, Spotify and Deezer, and we do not have access to the terms of these agreements. Other rightsholders are collectively licensed. These licenses are not public.
Generally, the revenues of the publishing side should move parallel to the recording side, but in our experience, because of the lower value of the publishing side, and the hybrid licensing model (direct or collective), far less care has been exerted to correctly document works. Our experience outside the UK shows that uncollected revenues may be significantly higher for the publishing side.
2.4 Unpaid Revenues
In the streaming services, a very significant number of uses are not matched with rightsholders. There are many reasons for this: - There are billions of transactions that have a very low value; the financial motivation to fix small administrative errors is minimal. - Because of the very low expected income for many works and recordings, often the present value of the proper documentation of the work and recording exceeds the likely present value of future revenues. The documentation is patchy. - There are no harmonized metadata standards, and righsholders cannot keep up with the documenting needs of billions of transactions.
The problem of these uses is that they use up a large part of the total revenues (that are financing both royalty payments and operating costs, including identification costs). The cycle of these unpaid royalties is seemingly long, but due to the complexity of the problem, very often the problem is never solved on time. These revenues, after cost deductions, will eventually land in some form of a ‘fund’ that will re-distribute these revenues to other rightsholders. This effect is a redistribution from less documented and typically small catalogues to large catalogues.
In emerging markets, the problems are so persistent, that often they are not solved over several resolution cycles. We have all reason to believe that the problem is more severe on the publishing side, at least partly because the value of the publishing side is smaller in streaming, and the licensing model is more complex—there are more things that can go wrong, and the revenue pot to solve the problem is smaller (Senftleben et al. 2021).
We do not want to suggest that all factors always move against niche genres and independent labels. This example tries to explain why a very fragmented industry like the UK music industry can face so different revenues and economic landscapes. An empirical examination of this problem is even more difficult than observing the average or typical rightsholder revenues, because the magnitude of the problem is unlikely to be independent of firm size, language, and other characteristics of the repertoire documentation.
2.5 Distortion of Earnings Distributions
In a study prepared by Rasmus Rex Pedersen for Koda (Pedersen 2020), the Danish rightsholder organization, local artists would have gained from WiMP in Denmark, August 2013 a 9.86% from a user-centric payout. In Norway, the local gain would have been 12.89%. In large repertoires, like the ones of Universal, Sony, WMG in 2013 the wins and gains were no more than 0.8%.
The study prepared by Deloitte for the CNM in France showed that various genres that are more liked by dedicated music fans, such as classical music, blues, and jazz, would have gained on average 0-20%. They have also shown that because much of the redistribution affects the very long tail, very few artists would really feel the change.

Figure 2.5: Typical difference between pro-rata and user-centric (hypohtethical) distribution, Deloitte 2021.
The difference between the two models is the weighting of subscribers. The pro-rata model divides up every user’s subscription fee based on the user’s use percentage. The user-centric model divides up the entire subscription fee on the percentage of the total streams, i.e. giving a bigger weight to users who listen to music more. Both distribution models are fair but distribute welfare differently. To use an everyday analogy, the pro-rata model keeps the tips at each waiter and waitress. The user-centric model collects all tips into a jar and divides it up among the staff of the restaurant.
The pro-rata model overweights young audiences, who tend to listen to more music, but also tend to choose the cheaper subscription models (ad-supported, family.) The user-centric model weighs users by their subscription fees, and they give a large weight to middle-aged and older users who tend to pay for more expensive subscriptions.
Older, and more affluent audiences tend to listen to music that they discovered when they were young (Holbrook and Schindler 1989; Holbrook M.B and Schindler R.M 2013; Stephens-Davidowitz 2018; Ong 2018), and which thus tend to be older artists. The pro-rata model favours artists who are listened to by young audiences, in particularl hip-hop, rap, and afrobeat, while the user-centric model favours classical, blues, jazz, disco, and rock, among others, which are more favored by middle-aged or older audiences.
Consider user A who pays 10 pounds for a service and listens to 10 songs in one month: this user “pays” for each of these songs as if each were worth 1 pound. The more dedicated user B, who listens to 333 songs, “pays” each song at about 0.03 pounds, or 3 cents. In economic terms, if User A does not cancel her subscription, we can say that her subjective valuation of playing a song is at least one pound. For User B, it is at least 0.03 pounds. Would user B be willing to pay 10 pennies per song, and end up paying £ 33.33 for her subscription? We do not know. We only know that she is willing to pay at least 3 cents for listening to one song.
The pro-rata model distributes to a song that was listened to three times by both User A and User B a total of 3 pounds + (3 x 0.03) pounds, all together 3.09 pounds, which after rounding will be equal to 3.1 pounds. A total of £20 was distributed in this case.
The user-centric model divides up the total 20 pounds on 343 song streams, and awards 2x3x(20/343), or 35 cents to the song. Again, this algorithm will distribute a total of £ 20.
This seems fair for the artists, but not for the users. Let’s imagine an artist-centric model where each user pays a subscription fee pro-rata her consumption. If we would set the price of each stream at 0.058 cents, user A would pay only 0.58 pounds per month for the subscription, while user B would pay 19.42 pounds for the higher consumption. The total subscription fee in this case would still equal to £20 for distribution, and in this case, the song would earn 2 x 3 x 0.0058 pounds, or 3.5 cents.
We could argue that the artist-centric model would be probably most in line with the equitable remuneration principle because each user who enjoys more music pays more. The pro-rata model can be seen as price discrimination model, which allows less price sensitive consumers to pay more for each song. The difference between the pro-rata and the hypothetical artist-centric model is the redistribution of the consumer surplus, i.e., the value that User A was willing to pay 33.3x times more for each song than User B. In the pro-rata model the entire consumer surplus is distributed to the song which could “exploit it,” while the user-centric model shares the consumer surplus among all rightsholders.
The effect is not small though, and it is multiplicative. To stay with the earlier example, when the GBP appreciates in value by 10% against the euro, the artist who has a large fan base in Europe has uncollected revenues of 5% and loses out on the pro-rata model another 15%, receiving 27.33% less revenue on 1000 (German, Slovak, Lithuanian, etc.) streams compared to 1000 fully paid streams in the UK.
The winners and losers are not equally distributed among artists. The top artists usually have dedicated fans, and casual listeners who just listen to whatever is on the charts. They would be losing with the user-centric system. Then there are stars of genres, who have dedicated music fans, and less popular artists, who only have dedicated fans – they would be winners.

Figure 2.6: Winners And Loosers With pro-rata and user-centric payouts; distribution effects by artist ranking
Our introductory example was very simple and posed a radical difference, because it was considering only 343 streams. The distribution effects on billions of streams largely cancel each other out, but not entirely. We have empirical estimates to the distribution effect between the pro-rata and the user centric model on artist level and on genre level, and on the level of independent versus major label catalogues. The smaller the level, the larger the standard deviation of the distribution effect. On the level of artists, this may run up to 30% and on the level of genres, which represent hundreds of thousands or millions of songs, the effect is around 20%. On the level of major labels versus independents, or on the level of ten million songs, the effect is in the single digits of percentages, often below 1%.
Most assets earn zero in each royalty distribution period, so they are not affected by the model choice. It seems that the pro-rata model significantly favours a smaller number of artists, genres, and labels, and the user-centric model would benefit many artists by a small percentage. All in all, while 10-30% seems like a big difference, 30% of 1 pounds is only 30 cents, and 30% of 0 pounds is still zero. In my opinion, the user centric model would benefit medium-sized labels and publishers and smaller countries, but it would have very little tangible benefit for the vast majority of individual artists.
We can infer from the Deloitte study that the majority of the righsholders, and practically all constituent artists of the CI-CEEMID index would be winners of the user-centric system (Deloitte 2021, p14), as the ‘typical’ or median song usually comes from artists similar to the median artists, who are in the Top 50001+ range.
Without further data, it is difficult to simulate this effect properly—it is unlikely that the losses and gains are normally distributed among artists, and it is also unlikely that the effect is constant in time. We believe that somebody who loses 15% in a month is likely to be among the losers in most months, but sometimes less, sometimes even more. Because the gains and losses are rooted in listening differences among genres and types of music, we believe that certain artists systematically gain or lose.